Understanding CPM: The Foundation of Traffic Monetization Economics
CPM is the single most important metric in traffic monetization. Here’s how it works and how to increase it.
For publishers, affiliate marketers, and content creators who monetize traffic, few metrics matter more than CPM. Yet CPM is frequently misunderstood and often treated as a simple dashboard number rather than the complex economic signal it actually represents.
Cost Per Mille, or CPM, is the amount advertisers pay for one thousand ad impressions. However, this simple definition does not explain everything. Each CPM value reflects a broader system that includes advertiser demand, how traffic is handled, how ads are selected, and how valuable that traffic is. All of these factors influence how much revenue your traffic can actually generate.
This article explains CPM in a clear and practical way. You will learn what CPM means, how it works inside advertising systems, how it applies to monetized links, and how to interpret it correctly as a publisher. Understanding CPM is essential before moving on to more advanced concepts such as eCPM, fill rate, or traffic optimization, because CPM is the foundation that determines how traffic turns into revenue.
Table of Contents
- What Is CPM
- How CPM Works in Digital Advertising
- CPM vs CPC vs CPA: Understanding the Differences
- How CPM Applies to Monetized Links
- Real CPM vs eCPM: What Publishers Actually Earn
- How to Calculate CPM in Monetized Link Scenarios
- Why Traffic Quality Directly Affects CPM
- How to Interpret CPM as a Publisher
- Conclusion: CPM as a Foundation of Monetization Strategy
What Is CPM
CPM stands for Cost Per Mille, where "mille" is Latin for thousand. Formally defined, CPM represents the cost an advertiser pays for 1,000 impressions of their creative asset.

The Economic Function of CPM
Advertisers use CPM when their primary objective is brand visibility rather than direct response. A CPM-based campaign aims to maximize reach and frequency across target audiences. The economic equation is straightforward: the advertiser pays a fixed rate for every thousand times their ad is rendered, regardless of whether users click or convert.
For publishers, CPM represents the monetization rate applied to their impression inventory. When a publisher reports earning a $10 CPM, they mean that for every 1,000 impressions served, gross revenue of $10 was generated before platform fees or revenue sharing.
Impression Counting Mechanics
Critical to understanding CPM is knowing what constitutes an impression. In digital advertising, impressions are typically counted using one of two methodologies:
- Served impressions: Counted when the ad server sends the creative to the publisher's inventory.
- Viewable impressions: Counted only when the ad has opportunity to be seen (generally 50% of pixels visible for at least one second).
For monetized links specifically, impressions are typically counted during the redirect process, at the moment when a user clicks the link and is routed through an intermediate domain before arriving at the final destination.
How CPM Works in Digital Advertising
Understanding CPM requires examining how it operates within advertising systems, particularly programmatic environments where most impression inventory is transacted.

The Auction Layer
In programmatic advertising, CPM is rarely a fixed rate. Instead, impressions are sold through real-time auctions where multiple demand sources bid for each impression opportunity. The winning bidder's CPM becomes the effective price for that impression.
The auction mechanics typically follow a second-price format: the winning bidder pays one cent above the second-highest bid, or their bid price if using first-price auctions (increasingly common). This means the final CPM for any given impression reflects real-time competition among advertisers valuing that specific user, at that moment, in that context.
Demand Source Variation
CPM varies dramatically across demand sources because different advertiser categories have different willingness to pay:
- Brand advertisers: Often pay premium CPMs for contextual alignment and audience quality.
- Performance advertisers: Bid based on expected conversion value, creating CPM floors tied to ROI.
- Retargeting campaigns: Frequently bid highest because they're pursuing known users with purchase intent.
- Remnant demand: Purchases unsold inventory at lower CPMs to fill remaining impressions.
This variation explains why the same traffic can generate different CPMs depending on how demand is routed and which advertisers compete for those impressions.
Geographic and Temporal Variance
CPM also fluctuates based on:
- Geography: Tier 1 countries (US, UK, Canada, Australia) typically command highest CPMs.
- Time of day: Advertiser budgets refresh daily, creating higher competition during peak hours.
- Seasonality: Q4 advertising demand increases CPMs across most verticals.
- Device type: Desktop often differs from mobile, with mobile web frequently lower than desktop.
CPM vs CPC vs CPA: Understanding the Differences
Professional monetization requires understanding how CPM relates to other pricing models and when each is appropriate.
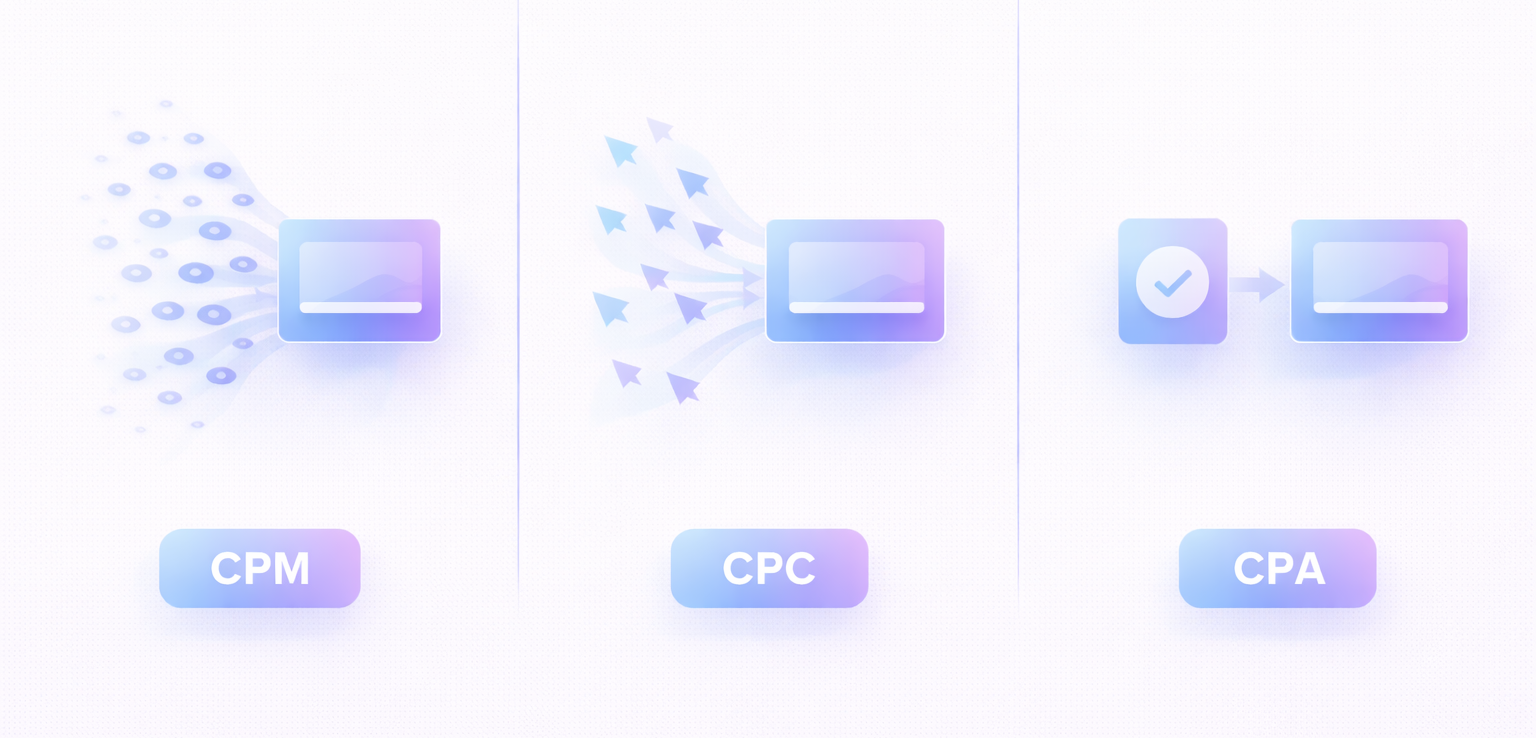
CPM vs CPC (Cost Per Click)
CPC charges advertisers only when a user clicks their ad. The publisher bears the risk of low click-through rates because they only earn when users engage.
The relationship between CPM and CPC is mathematical:
- CPM = (CTR × CPC) × 1000
If an ad has a 1% CTR and a $0.50 CPC, the equivalent CPM is $5.00. This conversion allows publishers to compare performance across pricing models.
When CPM is preferred: Publishers with high-quality, engaged audiences who may not click but are valuable for brand awareness.
When CPC is preferred: Performance-focused campaigns where direct response is the goal.
CPM vs CPA (Cost Per Action)
CPA charges advertisers only when a specific action occurs, such as a purchase, signup, or other conversion. This model transfers the highest level of risk to publishers, who must bear the cost of all impressions and clicks that do not result in a conversion.
It is also commonly referred to as cost per acquisition, since the advertiser pays only when a new customer or desired user action is successfully acquired.
The relationship requires factoring conversion rate:
- CPM = (CTR × CR × CPA) × 1000
A campaign with 1% CTR, 5% conversion rate (CR), and $20 CPA generates a $10 CPM equivalent.
When CPM is preferred: Brand awareness, retargeting, and upper-funnel objectives.
When CPA is preferred: Direct response with clear attribution and performance tracking.
How Monetized Links Use These Models
Monetization link platforms typically aggregate demand across all three models but present payouts to publishers as CPM or eCPM. The platform bears the model conversion risk, paying publishers based on impressions while managing CPC and CPA campaigns from advertisers.
How CPM Applies to Monetized Links
Monetized links represent a specific implementation of CPM-based monetization that differs from traditional display advertising.
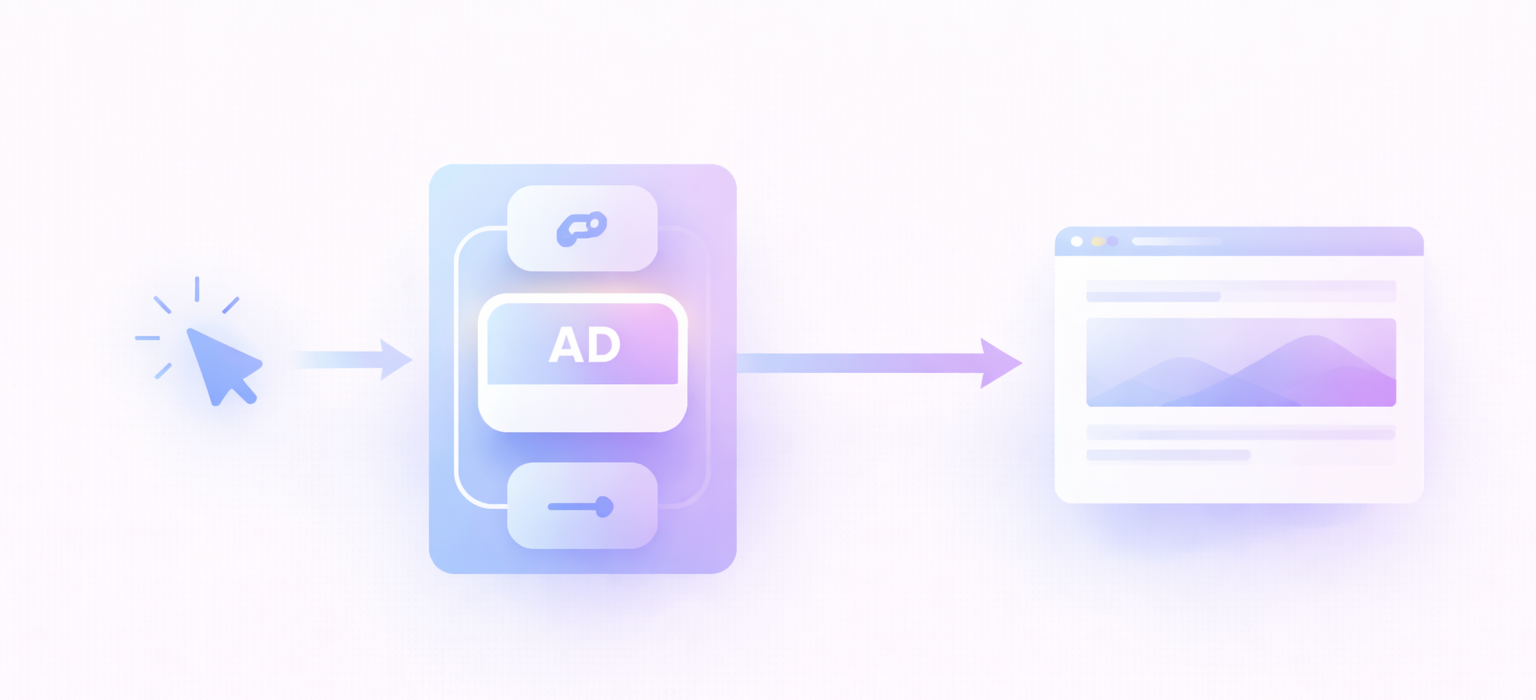
The Technical Flow
When a publisher creates a monetized link, they generate a URL that routes through an intermediate domain before redirecting to the final destination. During this redirect, the following occurs:
- User clicks the monetized link.
- Request hits the monetization platform's server.
- Platform checks available demand for that user/geo/context.
- If demand exists, an impression is recorded and the user passes through.
- If no demand exists, the user is routed directly (bypass).
The impression is counted during this redirect moment, typically as a server-side event confirming the user passed through the monetization layer.
Impression Rate vs Click Volume
Critical to understanding CPM in monetized links is recognizing that not every click results in a monetized impression. The impression rate, defined as the percentage of clicks that successfully generate an impression, depends on several technical and traffic related factors, including:
- Fill rate: Percentage of requests with available demand.
- Bypass rate: Percentage of traffic routed directly due to quality flags or technical issues.
- Platform routing logic: How the platform matches traffic to demand.
A link may have 10,000 clicks but only 8,000 monetized impressions if fill rate is 80%. Revenue is calculated on impressions, not clicks.
Contribution to Total Link Value
For a monetized link, total revenue equals:
- (Clicks × Impression Rate × CPM) / 1000
If a link receives 10,000 clicks with 80% impression rate and $15 CPM, revenue is:
- (10,000 × 0.8 × $15) / 1000 = $120
This calculation reveals why optimizing both impression rate and CPM matters more than focusing on either in isolation.
Real CPM vs eCPM: What Publishers Actually Earn
The distinction between nominal CPM and eCPM is fundamental to accurate monetization analysis.
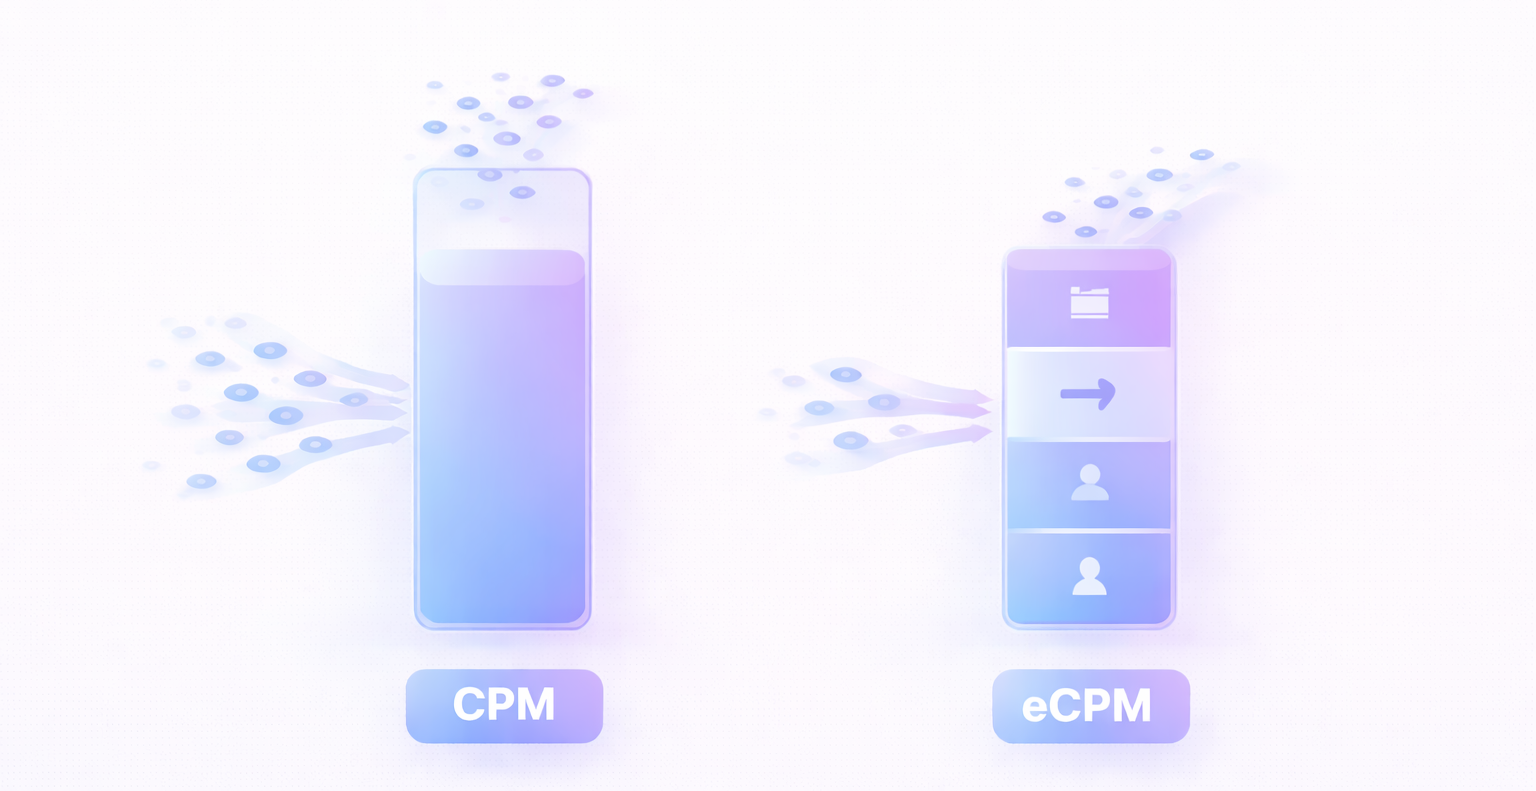
Nominal CPM Defined
Nominal CPM is the rate applied to impressions that monetize. If a platform reports a $12 CPM for a campaign, that means each thousand monetized impressions generates $12 in gross revenue.
However, nominal CPM only tells part of the story because it ignores impressions that failed to monetize.
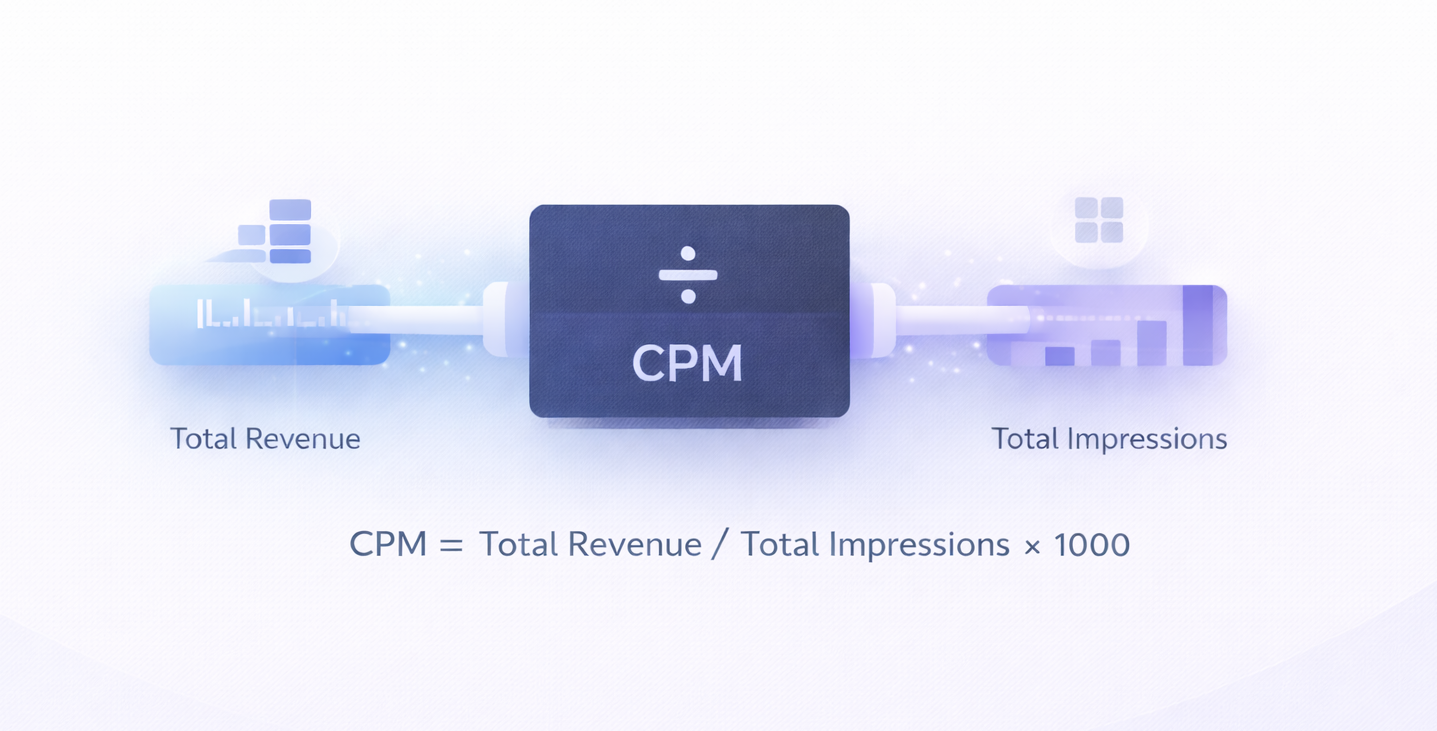
eCPM Defined
eCPM, or effective Cost Per Mille, represents the average revenue generated per thousand impressions, taking into account all impressions, including those that did not produce revenue. The calculation is:
- eCPM = (Total Revenue / Total Impressions) × 1000
If a publisher had 100,000 total impressions, of which 80,000 monetized at a $15 CPM, total revenue is $1,200. eCPM equals ($1,200 / 100,000) × 1000 = $12.
The $3 difference between nominal CPM ($15) and eCPM ($12) represents the revenue lost to unfilled impressions.
Why eCPM Matters More
For publishers, eCPM is the most accurate measure of monetization performance because it reflects the value generated across the entire inventory. Optimizing for nominal CPM alone can be misleading, since increasing CPM by accepting only premium demand may reduce the fill rate so significantly that overall eCPM ends up decreasing.
Professional monetization strategies optimize for eCPM by balancing CPM rates against fill rate, bypass rate, and traffic quality considerations. Understanding fill rate as a separate concept is essential to this optimization.
How to Calculate CPM in Monetized Link Scenarios
Working through a concrete example clarifies how CPM translates to actual revenue.
Example Scenario
Consider a publisher who drives traffic to monetized links with the following parameters:
- Monthly clicks: 50,000.
- Impression rate: 85% (42,500 monetized impressions).
- Reported CPM: $18.50
Step 1: Calculate gross revenue from monetized impressions
- (42,500 × $18.50) / 1000 = $786.25
Step 2: Calculate total impressions (including non-monetized)
- 50,000 total clicks (assuming each click generates an impression opportunity)
Step 3: Calculate eCPM
- ($786.25 / 50,000) × 1000 = $15.73
What the Numbers Reveal
The $2.77 difference between nominal CPM and eCPM ($18.50 vs $15.73) represents a 15% loss to unfilled inventory. Improving fill rate from 85% to 95% would increase eCPM to:
- (47,500 × $18.50) / 1000 = $878.75
- ($878.75 / 50,000) × 1000 = $17.58
This $1.85 increase in eCPM represents 11.8% higher revenue from the same traffic volume, demonstrating why optimizing fill rate is just as important as negotiating higher CPM rates.
Advanced Calculation Considerations
More sophisticated analysis might segment CPM by:
- Geography: Calculate CPM separately for each country.
- Device type: Compare mobile vs desktop performance.
- Time of day: Identify peak monetization periods.
- Traffic source: Determine which sources deliver highest CPM.
This segmentation enables targeted optimization rather than treating all traffic uniformly.
Why Traffic Quality Directly Affects CPM
Traffic quality is not an abstract concept. It directly determines the CPM rates that advertisers are willing to pay.

Quality Signals Advertisers Evaluate
When advertisers bid on impression opportunities, their algorithms evaluate numerous quality signals:
Geographic signals
- Country of origin.
- Region or designated market area (DMA).
- Postal code-level demographics.
Behavioral signals
- Browser history and cookies
- Device fingerprinting data
- Previous interaction with advertiser sites
Contextual signals
- Referring domain
- Content environment
- Time of day and day of week
Technical signals
- Device type and operating system
- Browser and version
- Connection type (wifi vs cellular)
- IP address reputation
The Quality-CPM Relationship
Higher quality traffic commands higher CPMs because advertisers expect better outcomes. A user from a Tier 1 country with commercial intent signals and a clean technical profile might generate $25 CPM, while traffic from a Tier 3 country with high bounce rates might generate only $2 CPM.
The mechanism is straightforward: advertisers bid based on expected value. If historical data shows users from Source A convert at 3% while Source B converts at 0.5%, bids for Source A traffic will be correspondingly higher.
How Traffic Quality Manifests in Monetized Links
For monetized links, quality affects CPM through:
Demand availability: Higher quality traffic attracts more demand sources, increasing competition and CPM.
Bid density: Multiple bids drive prices up through auction mechanics.
Platform routing: Quality traffic may be routed to premium campaigns with higher rates.
Conversely, low-quality traffic may be:
- Routed to lower-paying demand
- Bypassed entirely (no impression)
- Filtered by advertisers who exclude certain sources
Understanding this relationship explains why two publishers with identical click volume can have dramatically different revenue—and why interpreting CPM requires understanding the traffic quality context.
How to Interpret CPM as a Publisher
Given the complexity behind CPM numbers, publishers need a framework for interpretation.
Benchmarking Correctly
Raw CPM figures are meaningless without context. Instead of asking "Is $15 CPM good?", ask:
- Compared to what? What CPM do similar publishers with comparable traffic quality achieve?.
- For which segment? What is the CPM for US desktop traffic versus global mobile?.
- Over what period? Is this CPM stable or reflecting seasonal variation?.
- At what fill rate? Does this CPM come with high or low impression rates?.
Diagnosing CPM Changes
When CPM fluctuates, systematically evaluate possible causes:
Demand-side factors
- Seasonal advertisent budget changes.
- New demand sources entering the market.
- Advertisers leaving the market.
- Changes in bidding algorithms.
Supply-side factors
- Traffic source mix shifting.
- Geographic distribution changing.
- Device type composition evolving.
- Technical issues affecting impression counting.
Platform factors
- Routing logic modifications.
- New demand partnerships.
- Quality threshold adjustments.
- Bypass rate changes.
Strategic Implications
Professional publishers treat CPM as a diagnostic tool, not a target. Rather than optimizing for CPM directly, optimize for:
- Traffic quality: Source users who generate higher advertiser demand.
- Geographic mix: Balance volume with Tier 1 country representation.
- User experience: Maintain engagement metrics that signal quality.
- Platform relationships: Work with monetization partners who can access premium demand.
When CPM increases, it is important to understand the underlying cause, as it may reflect genuine improvements in traffic quality or simply seasonal demand fluctuations. When CPM decreases, publishers should diagnose the root cause before taking corrective action.
Conclusion: CPM as a Foundation of Monetization Strategy
CPM is not merely a metric displayed in a dashboard. It is the core economic indicator of how advertising markets value your traffic. Understanding CPM requires looking beyond the nominal rate and analyzing fill rates, traffic quality, demand sources, and the technical processes that determine how impressions are delivered.
For publishers who are optimizing link monetization, this knowledge is crucial. Every decision about traffic sourcing, audience development, and platform partnership ultimately affects CPM. The publishers who thrive are those who recognize CPM as a complex signal requiring continuous interpretation and optimization.
Start by measuring eCPM accurately across different traffic segments. Develop a clear understanding of how your traffic quality aligns with market demand. Then optimize in a structured way by improving traffic quality, increasing fill rates, and working with monetization partners that can connect your audience with the most relevant and valuable demand sources.
CPM provides the foundation. What you build on that foundation determines your long-term monetization success.